Apps, maps, and pin drops have all had an extreme transformation since the turn of the century. Apps were only offered at restaurants, maps were meticulously folded in glove compartments, and pin drops were only a concern for tailors & seamstresses with open-toed shoes. In today’s world where snake-less mobile devices walk among us, apps, maps, and pins are commonplace words associated with digital experiences.
For a lot of the applications we leverage on a daily basis, the map is the user experience. These objects have turned into a familiar pattern and easily fulfill a “need” within context. Discerning that ‘need’ for prospective or existing clients is what we find to be most difficult. To compound the situation further: the more functionality, the greater risk you run of diluting your goals for the product. This post seeks to remedy confusion by exploring the potential needs for a map. I’ll be describing four distinct use cases for maps that we’ve seen at LaunchPad, and the related considerations we expose to customers during Product Discovery sessions.
Guiding Users with Real-Time Navigation
Though all of the use cases presented in this blog post are popular, this pattern is the most recognizable and familiar (very mappy): providing your user with real-time directions and an estimated time of arrival. This mostly takes form in any native map-plication as well as the in-ride customer experience for any number of ridesharing applications (think Lyft, Uber, etc.). This use case takes us (quite literally) where we need to go. Though the Map itself isn’t necessarily needed to follow the directions generated or estimated arrival, it does provide a sense of security and gravitas to the experience as the background.
Where It Works Best
Ridesharing Apps (Lyft), Google Maps
Lyft’s app is focused on one goal with their users: taking them directly where they need. The first element at the top of the screen (signaling its importance) is a form field to capture your current location and desired destination. In the subsequent “steps” while scanning south, the user is able to navigate different price points, payment, scheduling, and expected time of arrival (will an Lyft XL or Lux Black XL really get me to work one minute faster?!).
The user experience for Google Maps, though still employing the backdrop of a map and location/destination fields at the top, is wildly different from the Lyft screenshot above. The application is built around navigation for the end-user, so the options provided to the user are very nuanced and built around extreme preference setting: What mode of transportation do I prefer and how will they influence my time of arrival? What are the coffee shops along the way? Are there any helpful landmarks that will help orient me? Can I preview the experience before I commit?
How We’ve Used It
Breadcrumb’s Get Directions Feature
Breadcrumb is a Native Application we built that employs bluetooth technology to assist outdoor enthusiasts in locating their Breadcrumb devices (such as a Location Marker). After soliciting customer feedback, the UI we built that plotted the device’s location was limiting – and more tactical directions were needed to help our users orient themselves. We then created this ‘Get Directions’ feature which leverages your phone’s preferred navigation application to provide directions to the destination.
August Hill Winery’s Wine Finder Feature
August Hill Winery has a web application we built that allows users to find their wines at local stores & provides directions to those stores. With the Wine Finder Feature, we plot the point of the store where August Hill Wines are stocked, provide a link for directions (like Breadcrumb’s Get Directions feature above), and also include other information that benefit the end-user’s fermented grape-seeking goals (products stocked, store details, street address). This particular client has a toe in two of the use cases I present: ‘Are we there yet?’, and the use case below ‘Take me there’!
Key Considerations
- Serving Directions: Should I provide turn-by-turn directions in bulleted form? Released throughout the ride in real-time? Should we include informal landmarks (i.e. turn right at the Burger King ahead)? What happens if/when your device is unable to connect to the internet? How do non-visual cues take form if a user is unable to look or handle their phone while navigating (i.e. audio directions)?
- Route Finder: Can I choose between multiple routes or set preferences on my routes? What if I want to avoid tolls or have a fear of turning left? What if I’ve missed a key direction, how should the experience change to my mistake?
- Viewport & User Journey: What do I show with my limited real estate on a mobile device vs a desktop user? Where will my product be used the majority of the time and in what capacity?
Helping Users Discover Destinations
The second use case is aspirational: showing the user where they’d like to go or avoid. There are several forms in which this takes place, but it’s most commonly seen in the form of a plotted pin or pins (think Yelp or Redfin). Your search is at the core of this feature, with the result being a pin or a set of pins and the accompanying display of information relating to those pins. Typically this use case is served as a complementary feature to the use case above – so be mindful of how these features might work in tandem.
Where It Works Best
Yelp
As indicated above, Yelp is to plotted aspirational addresses as Kleenex is to facial tissues. The search is paramount, and thus affixed to the top of the screen. To further complement the search (only requiring a term and location), there’s affordances for any type of filter imaginable in the left-handle panel, as well as the ability to interact with the map as a live search experience (i.e. the ‘Search as map moves’ checkbox).
Redfin
Redfin presents plotted addresses and the information regarding those addresses at nearly similar levels of importance (as seen by the width each interface occupies on the screen). Since the map is placed “first” on the screen as you scan the webpage, this can be a nod to the real estate adage: location, location, location. However, given the amount of space the listing cards occupy, Redfin is also looking to push the user to think “is this a place I can see myself making my home?” Other notable features for Redfin include the ability to actually draw on the map for searching, and the clustering of like results (i.e. multi-unit buildings).
How We’ve Used It
artlook Map
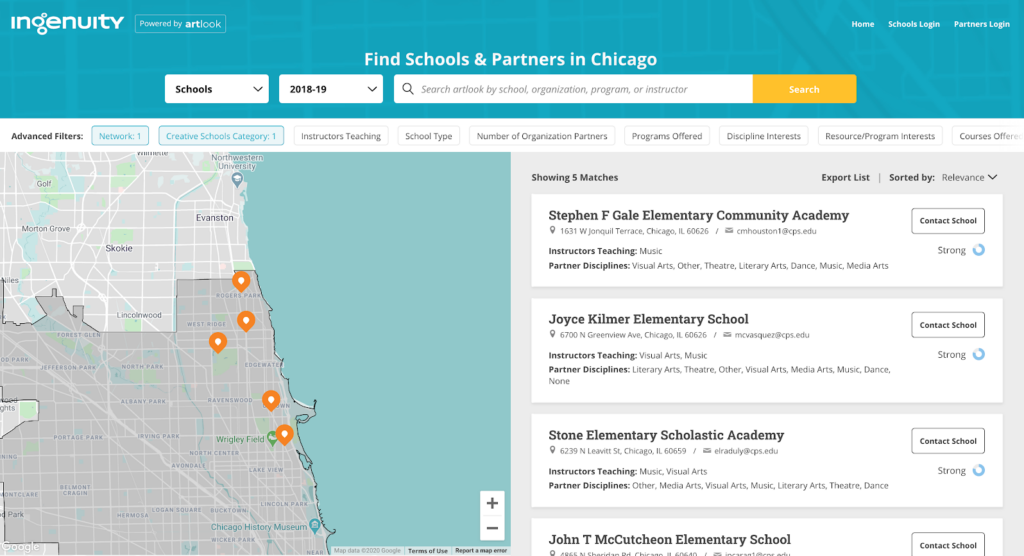
Artlook Map is a web application that helps cities across the U.S. track access to the arts for students in their schools. The artlook platform has three distinct experiences for end users: two features focus on capturing data, and the third on displaying that data on a map via plotted pin(s). Our LaunchPad Lab team has seen many iterations of this experience and we’ve worked closely with our friends at Ingenuity to further optimize the searching, filtering, and map UX for several years.

Key Considerations
- Searching/Filtering: Should you encourage a user to start with a broad search and filter on the results page? Or do you push users towards a robust set of filters at the onset? What happens if no such result can be found?
- Updating Results: When should you update the results plotted? How should you update the results plotted: automatically or manually, re-run by the user? Does any user-oriented action warrant an updating in results (i.e. interacting with the map interface)?
- Pin Density & Clustering: How do you solve for pins that are too close to discern? How many pins do you choose to display at a time? Are you concerned about overwhelming your user with too many results? If you look to cluster pins in the same location, how do you serve up the variations for that location (i.e. units within a building for a realty search)?
- Borders: Where is the applicable searchable area? Should the search reset based on Map movement? What happens when a user zooms in or out? Can users set their own borders (i.e. drawing)?
- Makeshift Visualization: Are your users looking for many results or just one (https://launchpadlab.com/blog/designing-modern-search-experiences/)? At what point do you shift efforts from a search to more of a reporting/data visualization feature?
Tracking and Sharing Locations
Where we’ve been/are is part of the human experience. Dropping pins or checking in at a location in 2020 is the same as Neil Armstrong planting a flag in 1969. This use case, albeit similar in display to the aspirational use case I’ve outlined above, has risen in popularity due to social media platforms. Central to any pirate story, x marks the spot where the hidden treasure is buried.
Where It Works Best
Google Maps Lists
The list feature in Google Maps allows users to mark notable places and is very useful for coordinating neighborhood bar crawls. As a nod to the social implications, you’re able to easily read customer ratings & testimonials (location depending), and easily share the list with others so they can either walk a mile in your shoes, or meet you on the crawl!
Instagram leverages the use of pins for users to tie posts to locations. Personally, this allows you to maintain a living collection of memories associated with location. Socially, this provides your friends with a great sense of FOMO over consuming the largest thin crust pizza on the Northside of Chicago. That’s the point, right?
How We’ve Used It
Breadcrumb’s Shared Location Marker Feature
Breadcrumb is a Native Application we built that employs bluetooth technology to assist outdoor enthusiasts in locating their Breadcrumb devices left outside (such as a Location Marker). Sometimes these devices can be left outside for several months at a time. Earlier in the article, I detailed out the ‘Get Directions’ features in relation to ‘Are we there yet?’ use case, however, given the literal nature of leaving and retrieving of the Breadcrumb Location Markers, the ‘Been there, done that’ use case also applies! There’s also a nifty experience in the app where you can also share the device location with other Breadcrumb users.
Key Considerations
- Social: What information do you give on the location? What information do you withhold? Do you allow users to create their own narrative or note about the location to assist in future recall? Do you serve up other users’ content? Do you allow the ‘owner’ of a location to control any of the posted content? How does the experience continue to live with the user?
- Map view: What type of backdrop should you consider? Map view vs Satellite view vs Street view?
Visualizing Data with Geographic Insights
Data visualizations are popular and useful: they look cool and drive decision-making if done correctly. Incorporating trends by geographic location can drive home whatever point you’re trying to make, however, this can be a risky undertaking. Given the attention span of users, the visualization needs to be concise yet comprehensive enough to be compelling.
Where It Works Best
Mostly scientific articles or News publications, reddit.com/r/dataisbeautiful

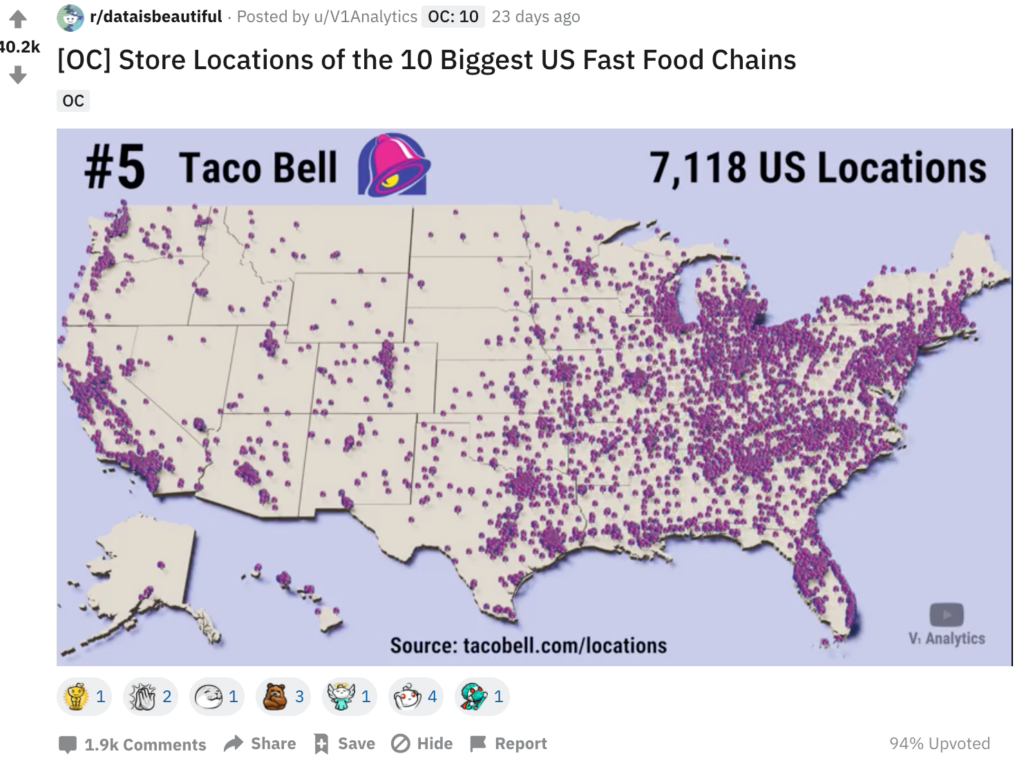
This visualization was pulled from Reddit’s Data is Beautiful subreddit, and it compares the number of the top ten fast food chains in the United States. Even though this visualization is animated, this paused screenshot communicates to the user the density of locations, the total count of locations, what place Taco Bell falls in the list, and the source of the data. Although novel, this visualization is concise yet comprehensive enough to induce crunchwrap supreme cravings.
Key Considerations
- Filtering: Is it a static visualization or can it be manipulated by changing variables? What variables are impactful to your user? Do you display variables within a filter even if data is unavailable? What do you display if no data is available? If your visualization is static, how does a repeat user view your experience?
- Data Integrity: How can you ensure your data is accurate? How often is your data updated or maintained?
- Comprehension: What messaging surrounds your visualization to help a user understand or digest what you’re looking to display? What interactions would be useful to include to keep your visualization fresh? Hover states? Tappable areas?
Conclusion
As a business owner or stakeholder, employing the use of a map can instantly boost your digital gravitas. Described above, the map pattern can help your users orient themselves in any number of situations. When looking to build a new or enhance your existing platform, simply look to the guide above to inform the optimal path forward and let the journey begin!


