By: Ramy Huffman / August 18, 2023
The following case study illustrates the importance and complexities of website performance optimization. It concisely highlights the value of Lighthouse Reporting and the challenges associated with analytics plugins that can often hinder performance scores.
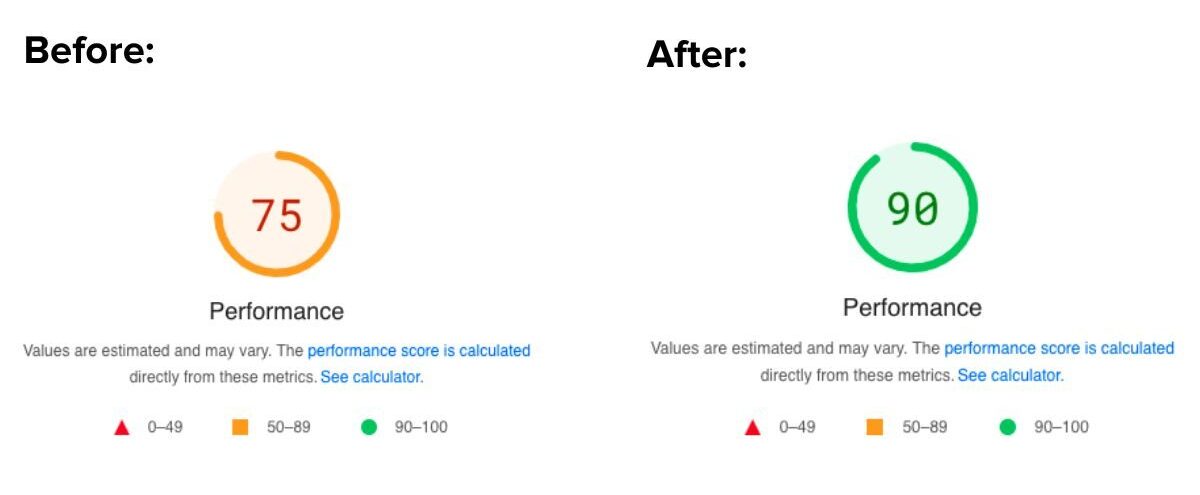
We recently worked on a Gatsby project where we were dealing with the challenges of a disappointingly low performance score. As you may be aware, grappling with performance bottlenecks and sluggish load times can be frustrating, especially when they impact user experience and hinder your website’s, and in turn your business’s, success.
This can have severe ramifications in today’s digital landscape where speed and user experience reign supreme and optimizing your website’s performance has become crucial for SEO success. Fortunately, the powerful combination of Gatsby and Google Lighthouse analytics can uncover effective strategies to significantly improve your website’s performance metrics!
Lighthouse reports play a crucial role in assessing the performance of web applications and provide valuable insights into various metrics including performance, accessibility, best practices, and SEO. However, one of the more frustrating points throughout this journey was the inherent variability of Lighthouse Reporting when consecutively testing on the same application and returning different results. According to Google’s official Lighthouse documentation, this variability is caused by multiple factors, including network conditions, device capabilities, and the complexity of the application being tested.
For example, testing a web app on a fast network connection or a powerful device may yield relatively high Lighthouse scores and infer everything is operating at peak performance. Though it may appear that everything is working efficiently, the same website on a slower network or a less capable device could lower the same scores in some instances by 10 points or more. Instead of focusing solely on nominal metrics, it’s more beneficial to consider the relative improvements and trends observed over time. By monitoring the changes in scores across different iterations, you can assess the impact of optimizations and track the overall progress of your application’s performance.
While Lighthouse reports are a valuable tool, it’s important to remember that they are not the sole indicator of your application’s performance. They should be used in conjunction with other performance measurement tools and real-world user testing to gain a holistic understanding of your website’s performance.
Netlify recently released an insightful webinar hosted by Netlify’s Senior Professional Services Engineer Grayson Hicks who shed light on Lighthouse Reporting and the impact of performance scores caused by analytics plugins. The biggest takeaway was how the implementation of analytics software, specifically Google Analytics and other similar analytics tools, are by design not to be performative and often detrimentally cripple an app’s performance scores.
One way to think of how these analytics plugins work is to use a stoplight analogy. Imagine a traffic light that knows when to let each car, or script in this case, pass efficiently. Just like how an ambulance or fire truck is given greater priority to move ahead of other cars, analytics scripts are prioritized even ahead of scripts that build your app. A traffic light in a busy intersection that tells all other cars to stop will result in a traffic jam and just like in the real world, the same thing happens with these scripts. The result creates a bottleneck issue in the app’s main thread and impacts its overall performance.
The most obvious solution would be to remove these performance-inhibiting scripts; however, then the client would lose critical data to understand customer engagement and conversion optimization. Since removing the analytics script was not an option, it was time to get creative and find other alternatives that can boost performance.
Drawing inspiration from Mattias Siø Fjellvang’s insightful article on “Constant Solutions,” we can implement a similar strategy to address the challenges of using third-party tracking tools by delaying the execution of the analytics script. In essence, each tracking event is still measured within the application, but by controlling when we transmit the data, we can significantly improve page load times and overall performance. The strategy revolves around three key points:
Adopting this approach enables the application to seamlessly integrate the metrics tool while reducing the occurrence of missing analytics data points. Once a user interacts with the page, the tracking script initializes promptly. As mentioned earlier, instances, where the visitor would remain untracked, occur if they navigate away from the page before approximately 3.5 seconds and haven’t engaged with the website at all. Such visits are considered less impactful for the marketing team and are disregarded.

Through slight modifications to the tracking script, we have achieved a balance between website performance and accurate tracking data. The optimized execution of Google Analytics ensures that we maintain a high Lighthouse Performance score while capturing crucial user interactions for precise analytics.
This implementation guarantees accurate tracking of visitors, providing valuable insights to the marketing team and fostering growth in the competitive digital landscape. If your organization faces the challenge of overcoming performance issues while heavily relying on third-party metrics tools, it becomes imperative to explore opportunities for optimizing their implementation. A simple change in the way data is transmitted can significantly improve your application’s performance.
Get in touch with our team for help solving your performance challenges!
Partner with us to develop technology to grow your business.